
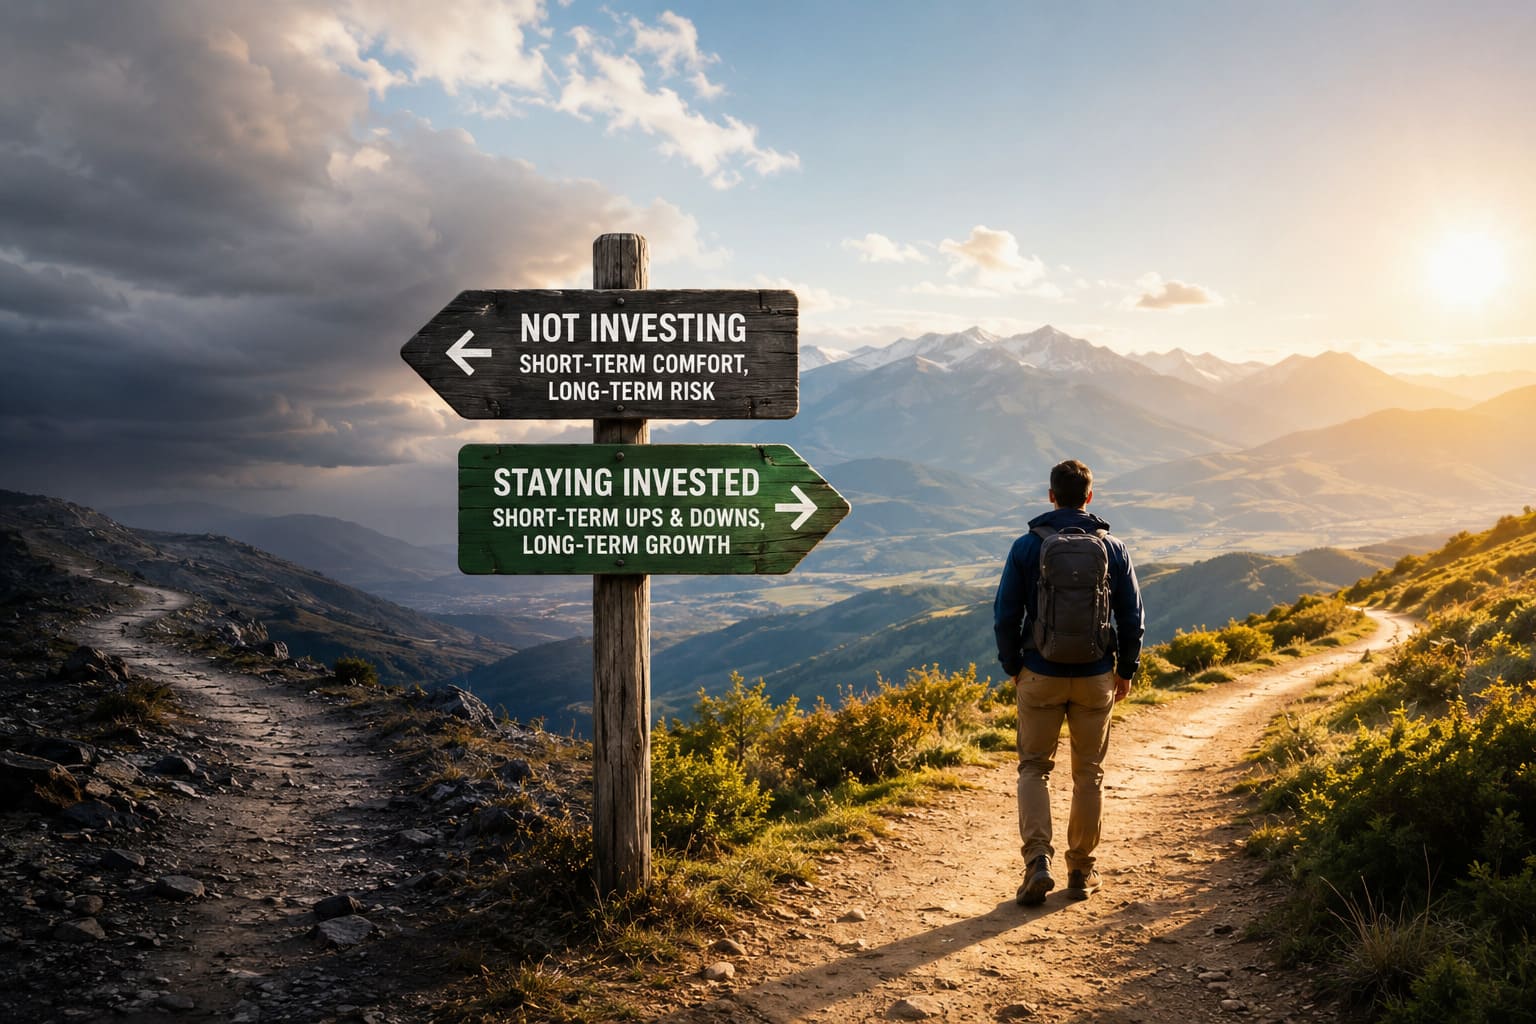
Most investors are terrified of losing money in the market. What they should fear most is not being in the market.
If you’ve ever withdrawn your investments during a downturn, saved cash “until the dust settles”, or procrastinated on starting to invest… read on.
There’s a piece of wisdom that all successful investors know that seems to go against logic:
Remaining invested through market ups and downs is virtually ALWAYS better than losing investment opportunities by NOT investing.
We’ll show you exactly why with some charts.
- The Hidden Cost of “Playing It Safe”
- The All-Important Rule: Don’t Miss the Best Days
- A Tale of Two Investors
- What About Market Crashes? Doesn’t Timing Help Then?
- Time in the Market vs. Timing the Market
- But What About Volatility? Isn’t That Risk?
- The Psychological Trap: Loss Aversion
- Practical Strategies to Stay Invested Through Turbulence
The Hidden Cost of “Playing It Safe”
Ask anyone what they think about when they hear the word “investment risk” and they’ll likely envision red on their charts and a smaller portfolio balance come morning. Ouch. That hurts. However, there’s another type of risk that doesn’t get enough attention. The pain of missed opportunity.
Simply, it’s called opportunity cost. The returns you miss out on by not being invested.
The All-Important Rule: Don’t Miss the Best Days
There’s one thing the past several decades of market data have taught us time and time again. It’s not fun to think about:
“If you miss the best days in the market, you lose most of the gains.”
Sharpe describes returns by calculating the ‘best’ days over several rolling periods.
Hypothetical Scenario: $100,000 Invested Over 20 Years
Assuming the market returns 10% per year on average (very close to the long-term average for the S&P 500), and “best days” are defined as referenced in numerous academic studies.
| Strategy | Ending Portfolio Value | Total Gain/Loss |
|---|---|---|
| Stayed fully invested | $672,750 | +$572,750 |
| Missed the 10 best days | $308,645 | +$208,645 |
| Missed the 20 best days | $193,481 | +$93,481 |
| Missed the 30 best days | $127,503 | +$27,503 |
| Held cash (2% savings rate) | $148,594 | +$48,594 |
Missing just 10 of the best trading days over 20 years cuts your ending wealth roughly in half.
The cruel irony is that the best days for the market are usually right after the worst ones. Investors who sell after panicking during a crash often miss the rapid rebound – forfeiting their chance at a recovery.
A Tale of Two Investors
Sarah and Michael are both 35 years old and have $50,000 to invest. Nearly everything about them is the same, except for how they approach investing.
Sarah: The Stay-Invested Investor
Sarah invests her $50,000 in a diversified index fund. She then invests consistently for 25 years without ever selling, even during downturns. She contributes $500 a month. She experiences three recessions, a global pandemic, and dozens of market corrections — but she holds steady and never sells.
Michael: The Market Timer
Michael invests his initial $50,000. He also contributes $500 per month, just like Sarah. But Michael gets nervous. During every major downturn, he hides his money in cash and misses an average of 15 of the best trading days of each major cycle. Michael misses out on the market for about 18 months out of the 25-year period.
Hypothetical Outcome at Age 60
Assumes 9.5% average annual return for Sarah; Michael’s effective return drops to approximately 6.8% after missed days and transaction costs.
| Sarah (Stay Invested) | Michael (Market Timer) | |
|---|---|---|
| Starting capital | $50,000 | $50,000 |
| Monthly contributions | $500 | $500 |
| Effective annual return | ~9.5% | ~6.8% |
| Portfolio at 60 | $821,000 | $487,000 |
| Difference | — | –$334,000 |
Michael’s anxiety cost him over $334,000 — not from bad stock picks, not from fees, but purely from trying to avoid short-term pain.
What About Market Crashes? Doesn’t Timing Help Then?
Good point. I guess if you can time getting out before a crash, you’re saving money, right?
The issue is predicting before. In reality, there is no one—no fund manager, no Nobel Prize-winning economist, no rocket scientist algorithm—that has successfully and reliably forecast market tops and bottoms over time.
Hypothetical: The 2020 COVID Crash
Say you have two investors. Both have $200,000 to invest as of February 2020.
Investor A panics when markets plummet 30% and shifts to cash at the bottom in late March 2020. They sit on the sidelines until “things make sense again” and invest in September 2020.
Investor B remains fully invested the entire time.
| Investor A | Investor B | |
|---|---|---|
| Portfolio (Jan 2020) | $200,000 | $200,000 |
| Portfolio (March 2020 low) | ~$140,000 → moves to cash | ~$140,000 (on paper) |
| Misses April–August recovery | $140,000 (in cash) | Recovers to ~$215,000 |
| Re-enters September 2020 | Buys back in | Still invested |
| Portfolio (Dec 2021) | ~$198,000 | ~$290,000 |
| Difference | — | +$92,000 |
Investor A felt like they were being prudent. In reality, they crystallised their losses and missed one of the fastest market recoveries in history.
Time in the Market vs. Timing the Market
This quote is arguably recited more than any other personal finance mantra. There is a reason for that. It simply states a mathematical truth: Compound interest rewards patience, not precision.
The Power of Starting Early
Let’s say we have three investors who all invest $10,000 one time and never invest another penny…
| Investor | Starts Investing | Annual Return | Value at 65 |
|---|---|---|---|
| Emma | Age 25 | 8% | $217,245 |
| Liam | Age 35 | 8% | $100,627 |
| Priya | Age 45 | 8% | $46,610 |
Priya waited 20 years. Her delay didn’t cost her $10k… it cost her $170,635. She was playing it “safe” by sitting in cash for 20 years, but that safety had a huge hidden cost.
But What About Volatility? Isn’t That Risk?
Yes – volatility definitely exists in the short-term. But long-term investors know volatility isn’t the same thing as permanent loss. Your portfolio only loses 25% of its value “forever” if you sell after taking a 25% paper loss.
Hypothetical Rolling 10-Year Returns on a Diversified Index
Sourced from simulated rolling periods matching the S&P 500’s historical performance:
| 10-Year Period | Annualised Return |
|---|---|
| Best 10-year window | +18.9% per year |
| Average 10-year window | +9.6% per year |
| Worst 10-year window | -1.2% per year |
| % of 10-year periods with positive returns | ~95% |
Even during the worst periods in history, a patient investor with a portfolio diversified across many assets held for 15+ years has virtually never lagged behind where they started. While there is a risk of short-term losses, there is extremely little risk of permanent loss over a long horizon if you are diversified.
The Psychological Trap: Loss Aversion
Studies in behavioural economics have found that humans experience the negative emotion of losing about twice as strongly as we feel the positive emotion of gaining.
This tendency is known as loss aversion, and it can wreak havoc on logical, long-term investing.
It explains why we perceive a 10% decline as devastating to our portfolio, even though a 10% gain once felt only like a mild thrill. Our brains are hardwired to focus on avoiding pain — great for dodging predators, bad for managing your retirement account.
Recognising this cognitive bias is half the battle.
Practical Strategies to Stay Invested Through Turbulence
We know you should stay invested for the long term. But actually doing it when markets plummet is tough. Try these tips backed by research:
- Make it automatic. Set up monthly investments so you never have to make the decision to invest. You’ll be one step ahead of your emotions if you never give them the opportunity to take over.
- Stop obsessively checking your investments. The more you check, the more you fret and the stronger the urge to do something becomes. If you’re investing for the long term, check quarterly or even monthly.
- Stay diversified. The more diversified your portfolio is across asset classes, countries, sectors, the less negative each drawdown will feel. Which makes it easier for you not to react.
- Maintain a cash emergency fund. Often investors sell investments when markets are down because they need cash. By keeping 3–6 months of expenses in a high-interest savings account, your investments can never be considered your emergency fund.
- Remember market volatility is your friend. When markets decline, your automatic investment is purchasing more units at a cheaper price. It’s called dollar-cost averaging and it works in your favour.
Summary: The Real Risk Scorecard
| Risk Type | Perceived Risk Level | Actual Long-Term Risk |
|---|---|---|
| Staying invested through volatility | High | Low (for diversified, long-term investors) |
| Moving to cash during a crash | Low | High (missed recoveries, lost compounding) |
| Delaying investment by 10 years | Low | Very High (significant wealth destruction) |
| Missing the 10 best market days | Unlikely | Halves your ending portfolio value |
The market rewards patience.
It seldom rewards forecasting. If you are a long-term investor holding diversified assets, the data clearly favors one strategy: remain invested, continue to save, and don’t let the noise influence you.
Thank yourself in the future!
Keep learning: courses on this topic
Self-paced courses to put this article into practice.
 Udemy
Investing For Beginners: How To Invest With Confidence
This Course is for you if ...1. You know nothing about investing.2. You are new to stock market investing and looking for a place to…
View course
 Udemy
How To Invest In Stocks The Complete Guide
A self-paced video course on stock investing, with practical lessons you can apply right away.
View course
 Udemy
Stocks & Bitcoin + Cryptocurrency: Trade, learn & Invest
Stocks & Bitcoin + Cryptocurrency: Trade and Invest Learn Proven Strategies for Stock Market Success and Crypto Mastery Are you ready to…
View course




Leave a Comment